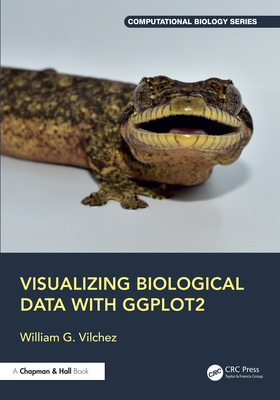
Visualizing Biological Data with Ggplot2
暫譯: 使用 Ggplot2 可視化生物數據
G. Vilchez, William
- 出版商: CRC
- 出版日期: 2026-08-30
- 售價: $6,770
- 貴賓價: 9.5 折 $6,431
- 語言: 英文
- 頁數: 232
- 裝訂: Hardcover - also called cloth, retail trade, or trade
- ISBN: 1032876581
- ISBN-13: 9781032876580
-
相關分類:
Data-visualization
海外代購書籍(需單獨結帳)
相關主題


商品描述
We are currently living in an era where technology is constantly advancing, which leads to the generation of large volumes and many types of data. Consequently, the ability to transform complex data into clear and attractive visualizations has become essential. Visualizing Biological Data with ggplot2 encourages readers to explore the power of visualization in biology, combining science and art to communicate findings clearly.
The first part of the book begins with a general overview of data visualization and then guides readers through the use of the R language, especially its visualization package called ggplot2. In the second part, the author introduces the creation of different visualizations, from basic graphs and tables to more complex representations such as phylogenetic trees, heat maps, and geographic maps, among others. Subsequently, in the third section, tips and strategies for optimizing the design of your graphs are presented. Finally, the author addresses the creation of interactive visualizations and explains the various options available for exporting and sharing your visualizations.
Features:
- Introduction to data visualization
- Explains the basics of R and its suite of packages called tidyverse
- Tutorial on ggplot2 to create a wide range of graph types
- Advice on when to avoid certain types of visualization which can lead to errors or confusion in the interpretation of results
- Strategies for customizing charts, ready for publication
- Numerous examples based on real biological data, which facilitate the practical application of the concepts learned
With a wide variety of biological examples and practical exercises, allowing readers to consolidate knowledge throughout this book, Visualizing Biological Data with ggplot2 is perfect for experienced students and researchers, while also serving as a graphic guide for anyone wishing to transform their data into visualizations.
商品描述(中文翻譯)
我們目前生活在一個科技不斷進步的時代,這導致了大量和多種類型數據的產生。因此,將複雜數據轉化為清晰且吸引人的視覺化能力變得至關重要。《使用 ggplot2 可視化生物數據》鼓勵讀者探索視覺化在生物學中的力量,結合科學與藝術以清晰地傳達研究結果。
本書的第一部分以數據視覺化的概述開始,然後引導讀者使用 R 語言,特別是其視覺化套件 ggplot2。在第二部分中,作者介紹了不同視覺化的創建,從基本的圖表和表格到更複雜的表示,如系統發生樹、熱圖和地理圖等。隨後,在第三部分中,提供了優化圖表設計的技巧和策略。最後,作者討論了互動式視覺化的創建,並解釋了導出和分享視覺化的各種選項。
**特色:**
- 數據視覺化介紹
- 解釋 R 語言的基礎及其套件組 tidyverse
- ggplot2 教學,創建各種圖表類型
- 提供何時避免某些視覺化類型的建議,以免導致結果解釋中的錯誤或混淆
- 自訂圖表的策略,準備發表
- 基於真實生物數據的眾多範例,便於實踐應用所學概念
《使用 ggplot2 可視化生物數據》提供了各種生物範例和實用練習,幫助讀者在整本書中鞏固知識,適合有經驗的學生和研究人員,同時也作為希望將數據轉化為視覺化的任何人的圖形指南。
作者簡介
William G. Vilchez holds a bachelor's degree in biology from the Universidad Nacional Pedro Ruiz Gallo (Peru) and is currently pursuing a master's degree in Cellular and Molecular Biology at the University of São Paulo (USP) in Brazil. His main motivation is to use data visualization as a tool to convey information clearly, accurately, and accessibly. Currently, he supports and encourages undergraduate students to use R for data analysis and visualization.
作者簡介(中文翻譯)
William G. Vilchez 擁有秘魯佩德羅·魯伊斯·加略國立大學的生物學學士學位,目前正在巴西聖保羅大學(USP)攻讀細胞與分子生物學碩士學位。他的主要動機是利用數據視覺化作為工具,以清晰、準確且易於理解的方式傳達信息。目前,他支持並鼓勵本科生使用 R 進行數據分析和視覺化。