Data Visualization with Microsoft Power Bi: How to Design Savvy Dashboards (Paperback)
暫譯: 使用 Microsoft Power BI 的資料視覺化:如何設計精明的儀表板 (平裝本)
Kolokolov, Alex, Zelensky, Maxim

買這商品的人也買了...
-
 $601雲端原生資料倉儲:原理與實務
Oreilly英文書展|任選2書8折 詳見活動內容 »
-
 90折
$2,520Data Engineering for Multimodal AI: Architecting Scalable Systems for Next-Generation AI Applications
-
90折
$2,520Data Engineering for Multimodal AI: Architecting Scalable Systems for Next-Generation AI Applications
-
 90折
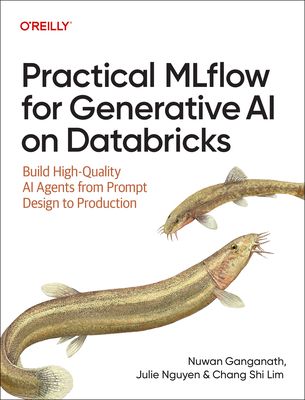
$2,592Practical Mlflow for Generative AI on Databricks: Build High-Quality AI Agents from Prompt Design to Production
-
 90折
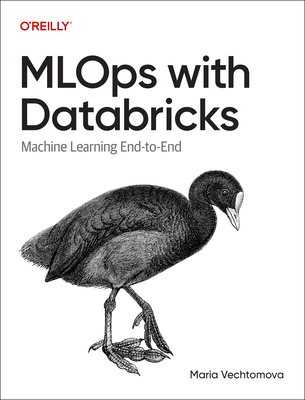
$2,457MLOps with Databricks: Machine Learning and Genai Applications End to End
-
 VIP 95折
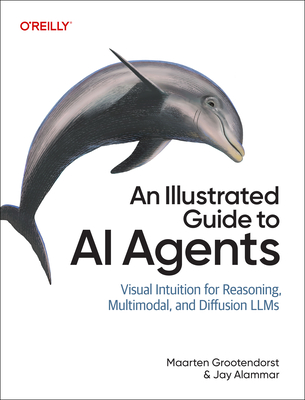
An Illustrated Guide to AI Agents: Concepts and Code for Building Agents with Llms, Tools, and Memory (Paperback)
$2,780$2,641 -
 90折
$2,520Blue Team Handbook: Soc, Siem, and Threat Hunting: Practical Techniques for Security Operations and Threat Hunting Teams
-
 90折
$1,944Building Agentic Solutions with Microsoft Foundry: Patterns, Workflows, and Best Practices for Intelligent Agents
-
 90折
$1,917Learning Cybersecurity Fundamentals: A Practical Guide to Essential Cybersecurity Concepts
-
 VIP 95折
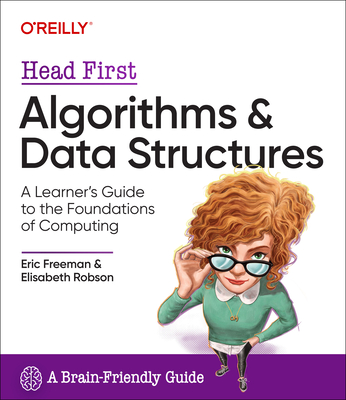
Head First Algorithms and Data Structures: A Learner's Guide to the Foundations of Computing (Paperback)
$2,780$2,641 -
 90折
$2,484Comptia Linux+ Study Guide: Essential Exam Prep
-
 90折
$2,520Video Generation with AI: Working with Diffusion Transformers and Multimodal Learning (Paperback)
-
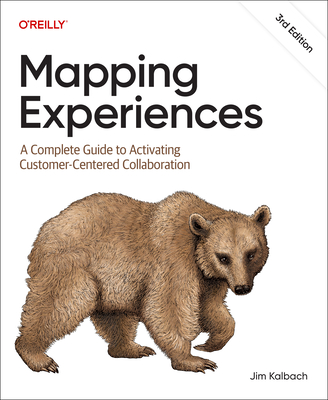 90折
$1,890Mapping Experiences: A Complete Guide to Activating Customer-Centered Collaboration 3/e
-
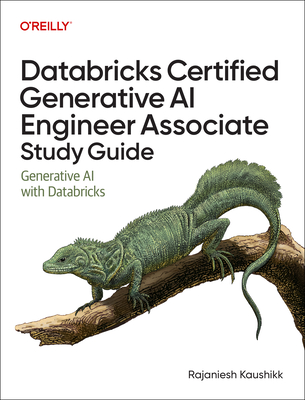 90折
$2,520Databricks Certified Generative AI Engineer Associate Study Guide: Generative AI with Databricks
-
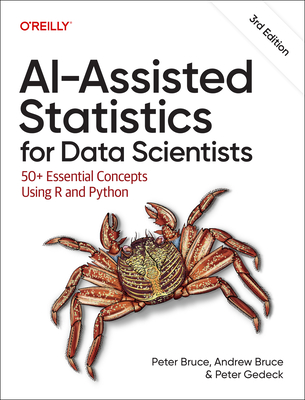 90折
$2,502Ai-Assisted Statistics for Data Scientists: 50+ Essential Concepts Using R and Python
-
 90折
$2,223Observability Engineering: Achieving Production Excellence, 2/e (Paperback)
-
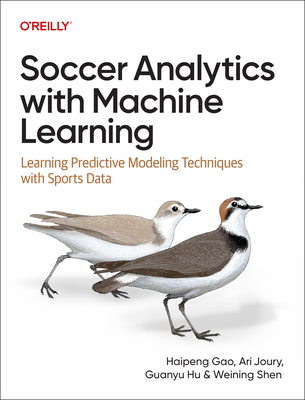 90折
$1,935Soccer Analytics with Machine Learning: Learning Predictive Modeling Techniques with Sports Data
-
 90折
$1,953The C4 Model: Visualizing Software Architecture (Paperback)
-
 90折
$1,935Learning Cloud Security: Cloud Computing and Security Architecture Essentials
-
 90折
$2,520Vision Language Models: Building Vlms with Hugging Face (Paperback)
-
 90折
$2,142High Performance Spark: Best Practices for Scaling and Optimizing Apache Spark 2/e
-
 90折
$1,944Python for Excel: A Modern Environment for Automation and Data Analysis
-
 90折
$1,440Managing AI Projects: Drive Innovation and Successfully Navigate the Full AI Project Lifecycle (Paperback)
-
 90折
$2,520AI-Ready Data Blueprints: From Raw Data to Ai-Driven Innovation (Paperback)
-
 90折
$1,917Certified Kubernetes Application Developer (Ckad) Study Guide: In-Depth Guidance and Practice (Paperback)
-
 90折
$2,484Large Language Models: The Hard Parts: Open Source AI Solutions for Common Pitfalls (Paperback)
相關主題

商品描述
The sheer volume of business data has reached an all-time high. By using visualizations to transform this data into useful and understandable information, you can facilitate better decision-making. This practical book shows data analysts as well as professionals in finance, sales, and marketing how to quickly create and use data visualizations.
Alex Kolokolov from Data2Speak and Maxim Zelensky from Datalineo Limited explain in simple and clear language how to use Microsoft Power BI to set up any visualization diagram. Managers with different professional backgrounds will learn how to "tame" data visualization, and step-by-step instructions will help you set up any chart professionally. The examples in this book clearly explain how customization facilitates the perception of data.
This book helps you understand:
- How interactive visuals can be useful for your business
- The basic rules for building charts
- Exceptions from general rules based on real business cases
- How to choose the right chart for every business case
- How to create interactive visuals in Power BI
- How to design corporate identity visuals
商品描述(中文翻譯)
商業數據的龐大量已達到歷史新高。透過使用視覺化將這些數據轉化為有用且易於理解的信息,您可以促進更好的決策。本書實用地向數據分析師以及金融、銷售和行銷專業人士展示如何快速創建和使用數據視覺化。
來自 Data2Speak 的 Alex Kolokolov 和來自 Datalineo Limited 的 Maxim Zelensky 用簡單明瞭的語言解釋如何使用 Microsoft Power BI 設置任何視覺化圖表。不同專業背景的管理者將學會如何「馴服」數據視覺化,逐步指導將幫助您專業地設置任何圖表。本書中的範例清楚地解釋了如何通過自定義來促進數據的感知。
本書幫助您理解:
- 互動視覺化如何對您的業務有用
- 建立圖表的基本規則
- 根據真實商業案例的例外情況
- 如何為每個商業案例選擇合適的圖表
- 如何在 Power BI 中創建互動視覺化
- 如何設計企業識別視覺化