Think STATS: Exploratory Data Analysis, 3/e (Paperback)
暫譯: Think STATS:探索性資料分析,第 3 版(平裝本)
Downey, Allen B.

- 出版商: O'Reilly
- 出版日期: 2025-05-13
- 定價: $2,800
- 售價: 9.0 折 $2,520
- 語言: 英文
- 頁數: 321
- 裝訂: Quality Paper - also called trade paper
- ISBN: 1098190254
- ISBN-13: 9781098190255
-
相關分類:
Python、Data-visualization、機率統計學 Probability-and-statistics
立即出貨 (庫存 < 4)
Oreilly英文書展|任選2書8折 詳見活動內容 »
-
 90折
$2,592Data Engineering for Multimodal AI: Architecting Scalable Systems for Next-Generation AI Applications
-
90折
$2,592Data Engineering for Multimodal AI: Architecting Scalable Systems for Next-Generation AI Applications
-
 90折
$2,592Practical Mlflow for Generative AI on Databricks: Build High-Quality AI Agents from Prompt Design to Production
-
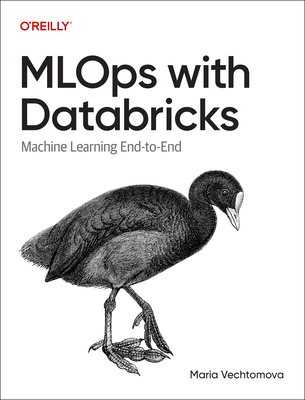 90折
$2,457MLOps with Databricks: Machine Learning and Genai Applications End to End
-
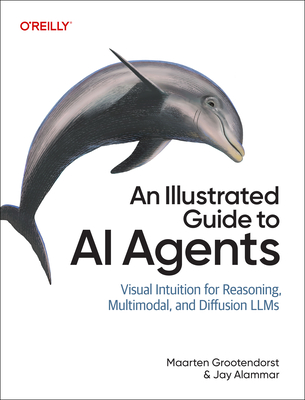 VIP 95折
An Illustrated Guide to AI Agents: Concepts and Code for Building Agents with Llms, Tools, and Memory
$2,760$2,622 -
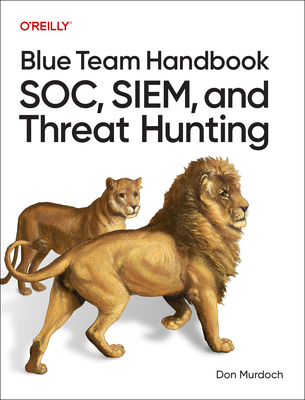 90折
$2,520Blue Team Handbook: Soc, Siem, and Threat Hunting: Practical Techniques for Security Operations and Threat Hunting Teams
-
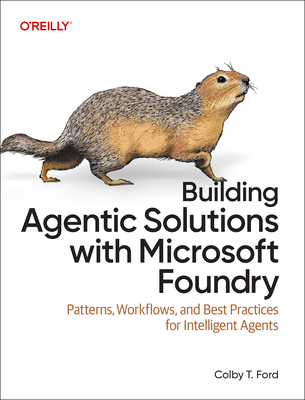 90折
$1,944Building Agentic Solutions with Microsoft Foundry: Patterns, Workflows, and Best Practices for Intelligent Agents
-
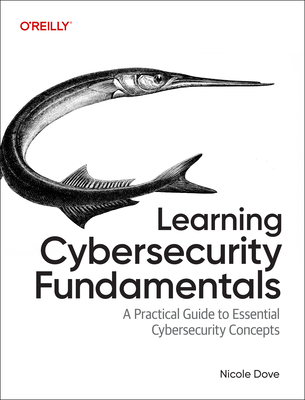 90折
$1,917Learning Cybersecurity Fundamentals: A Practical Guide to Essential Cybersecurity Concepts
-
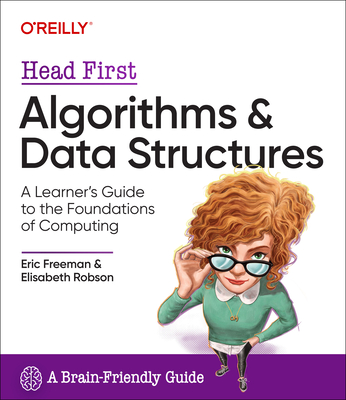 90折
$2,592Head First Algorithms and Data Structures: A Learner's Guide to the Foundations of Computing
-
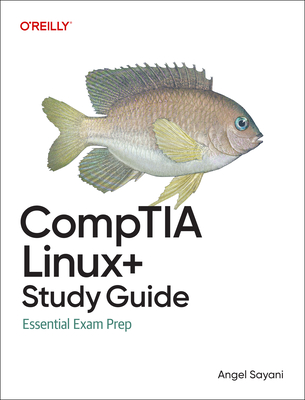 90折
$2,484Comptia Linux+ Study Guide: Essential Exam Prep
-
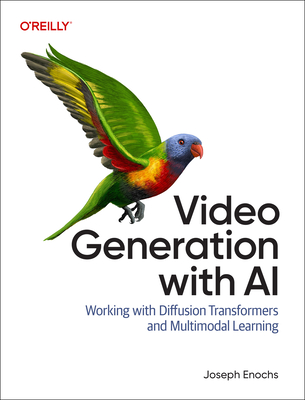 90折
$2,520Video Generation with AI: Working with Diffusion Transformers and Multimodal Learning (Paperback)
-
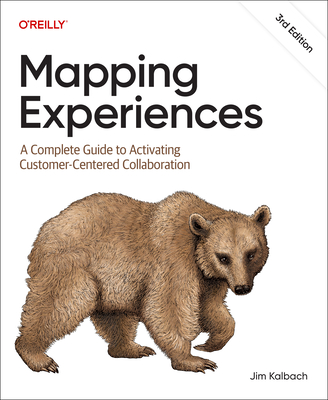 90折
$1,890Mapping Experiences: A Complete Guide to Activating Customer-Centered Collaboration 3/e
-
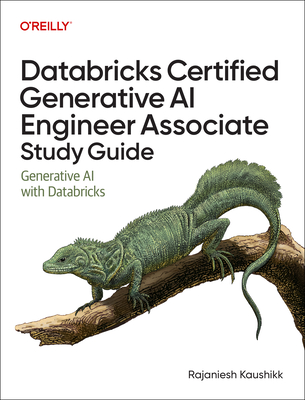 90折
$2,493Databricks Certified Generative AI Engineer Associate Study Guide: Generative AI with Databricks
-
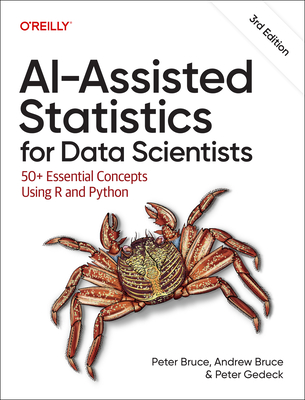 90折
$2,502Ai-Assisted Statistics for Data Scientists: 50+ Essential Concepts Using R and Python
-
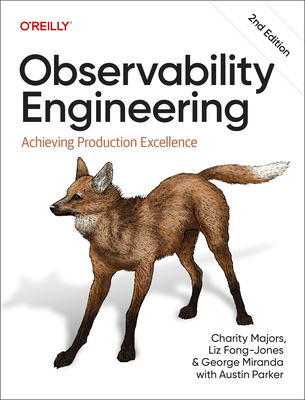 90折
$2,268Observability Engineering: Achieving Production Excellence, 2/e (Paperback)
-
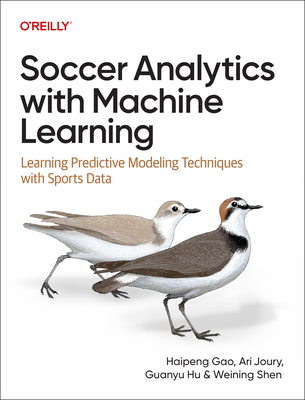 90折
$1,935Soccer Analytics with Machine Learning: Learning Predictive Modeling Techniques with Sports Data
-
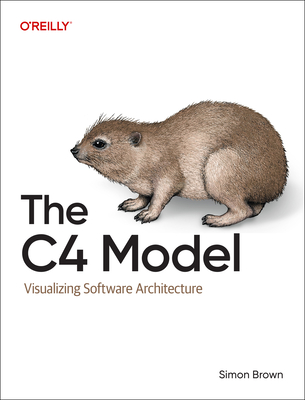 90折
$1,926The C4 Model: Visualizing Software Architecture (Paperback)
-
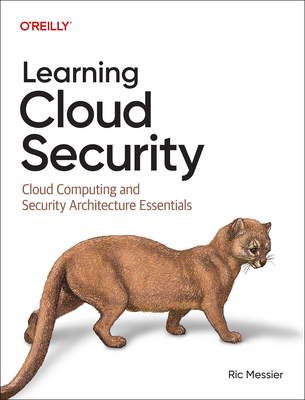 90折
$1,935Learning Cloud Security: Cloud Computing and Security Architecture Essentials
-
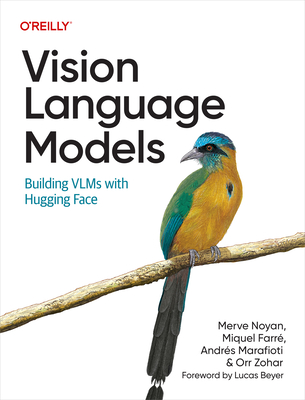 90折
$2,502Vision Language Models: Building Vlms with Hugging Face (Paperback)
-
 90折
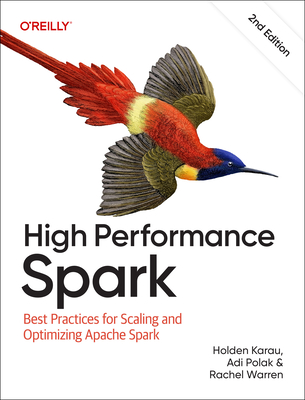
$2,142High Performance Spark: Best Practices for Scaling and Optimizing Apache Spark 2/e
-
 90折
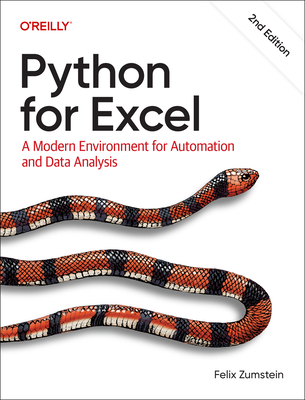
$1,944Python for Excel: A Modern Environment for Automation and Data Analysis
-
 90折
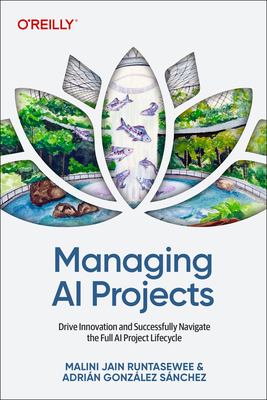
$1,440Managing AI Projects: Drive Innovation and Successfully Navigate the Full AI Project Lifecycle (Paperback)
-
 90折
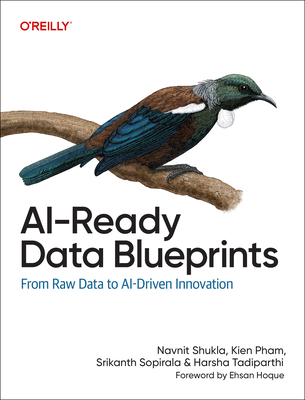
$2,520AI-Ready Data Blueprints: From Raw Data to Ai-Driven Innovation (Paperback)
-
 90折
$1,917Certified Kubernetes Application Developer (Ckad) Study Guide: In-Depth Guidance and Practice (Paperback)
-
 90折
$2,484Large Language Models: The Hard Parts: Open Source AI Solutions for Common Pitfalls (Paperback)
相關主題


商品描述
If you know how to program, you have the skills to turn data into knowledge, using the tools of probability and statistics. This thoroughly revised edition shows you how to perform statistical analysis computationally, rather than mathematically, with programs written in Python. Through practical examples and exercises that follow a collection of real-world datasets, you'll learn the entire process of exploratory data analysis--from collecting data and generating statistics to identifying patterns and testing hypotheses.
Whether you're a data scientist, software engineer, or data enthusiast, you'll get up to speed on commonly used tools including NumPy, SciPy, and Pandas as you explore distributions, relationships between variables, visualization, and many other concepts. And this updated guide has been fully moved into Jupyter notebooks, so you can read the text, run the code, and work on exercises all in one place.
- Analyze data distributions and visualize patterns using Python libraries
- Improve predictions and insights with regression models
- Dive into specialized topics like time series analysis and survival analysis
- Integrate statistical techniques and tools for validation, inference, and more
- Communicate findings effectively with enhanced data visualization practices
- Troubleshoot common data analysis challenges
- Boost reproducibility and collaboration in data analysis projects with interactive notebooks
商品描述(中文翻譯)
如果你會程式設計,就具備了運用機率與統計工具,將資料轉化為知識的能力。本次大幅修訂的版本將使用 Python 撰寫的程式,教你以計算方式而非數學方式執行統計分析。透過配合一系列真實世界資料集的實務範例與練習,你將學習探索性資料分析(exploratory data analysis)的完整流程——從收集資料、產生統計量,到辨識模式與檢驗假設。
無論你是資料科學家、軟體工程師或資料愛好者,都能在探索分布、變數之間的關係、視覺化及許多其他概念的過程中,熟悉 NumPy、SciPy 和 Pandas 等常用工具。此外,本次更新的指南已完整移轉至 Jupyter notebooks,讓你能在同一個地方閱讀文字、執行程式碼並完成練習。
• 使用 Python 程式庫分析資料分布並將模式視覺化
• 使用迴歸模型改善預測與洞察
• 深入探討時間序列分析與存活分析等專門主題
• 整合統計技術與工具,以進行驗證、推論及其他工作
• 透過強化資料視覺化的實務,有效傳達分析結果
• 排除常見的資料分析問題
• 使用互動式 notebooks 提升資料分析專案的可重現性與協作效率