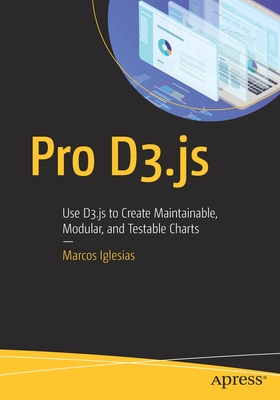
Pro D3.Js: Use D3.Js to Create Maintainable, Modular, and Testable Charts
暫譯: Pro D3.Js:使用 D3.Js 創建可維護、模組化和可測試的圖表
Iglesias, Marcos
- 出版商: Apress
- 出版日期: 2019-11-01
- 定價: $1,750
- 售價: 8.0 折 $1,400
- 語言: 英文
- 頁數: 223
- 裝訂: Quality Paper - also called trade paper
- ISBN: 1484252020
- ISBN-13: 9781484252024
-
相關分類:
Data-visualization
立即出貨 (庫存=1)
買這商品的人也買了...
-
 創新科技設計|基因組學、機器人學與物聯網的UX設計(Designing for Emerging Technologies: UX for Genomics, Robotics, and the Internet of Things)
$680$537 -
 UX 從新手開始|使用者體驗的 100堂必修課 (UX for Beginners: A Crash Course in 100 Short Lessons)
$480$379 -
 遊戲化實戰全書:遊戲化大師教你把工作、教學、健身、行銷、產品設計……變遊戲,愈好玩就愈有吸引力!(Actionable Gamification: Beyond Points, Badges, and Leaderboards)
$480$408 -
 資訊架構學, 4/e (Information Architecture: For the Web and Beyond, 4/e)
$680$537 -
 Mastering SVG: Web animations, visualizations and vector graphics with HTML, CSS and JavaScript
$1,520$1,444 -
 重構|改善既有程式的設計, 2/e (繁中平裝版)(Refactoring: Improving The Design of Existing Code, 2/e)
$800$632 -
 晉昇軟體最高殿堂:Jenkins2 持續整合大師之路
$600$474 -
 有腦設計|運用腦科學打造好產品 (Design for How People Think: Using Brain Science to Build Better Products )
$520$410 -
 Spring Cloud & Docker 雙劍制霸:微服務架構實戰應用技術 (舊名: 徹底改變 Spring Cloud 的生態:使用 Docker 實作微服務架構)
$650$553 -
 不只是金融商品:區塊鏈技術用程式碼實作 (熱銷版)(二版)
$580$493 -
 TypeScript 程式設計 (Programming TypeScript)
$580$458 -
 $534深入淺出大型網站架構設計
 -
 Spring Boot 情境式網站開發指南|使用 Spring Data JPA、Spring Security、Spring Web Flow
$580$493 -
 NLP 工程師養成術:自然語言處理入門
$690$538 -
 $504OpenShift 雲原生架構 -- 原理與實踐
 -
 $402RPA 開發與應用
 -
 原來世界是這樣運轉的:微服務架構原理與實戰
$780$616 -
 多元裝置時代的 UI/UX 設計法則:打造出讓使用者完美體驗的好用介面, 2/e
$450$315 -
 Three.js 前端三維圖形開發案例集錦
$768$729 -
 Figma UI/UX 設計技巧實戰:打造擬真介面原型
$600$468 -
 Solidity 實戰全書:完整掌握智能合約!成為獨立開發 Dapp 的區塊鏈工程師
$650$507 -
 Test-Driven Development 學習手冊
$580$458 -
 「新」SEO 超入門!打敗 AI、征服搜尋引擎,洞悉使用者需求的必備指南
$630$567 -
 $657UI 智能化與前端智能化:工程技術、實現方法與編程思想
 -
 決戰!微前端架構 Micro Frontends:新一代可擴展的網頁開發模式,實現各種框架的無縫整合與溝通
$820$738
商品描述
Go beyond the basics of D3.js to create maintainable, modular, and testable charts and to package them into a library that can be distributed as open source software or kept for private use. This book will show you how to transform regular D3.js chart code into reusable and extendable modules.
You know the basics of working with D3.js, but it's time to become a professional D3.js practitioner. This book is your launching pad to refactoring code, composing complex visualizations from small components, working as a team with other developers, and integrating charts with a Continuous Integration system. You'll begin by creating a production-ready chart using D3.js v5, ES2015, and a test-driven approach and then move on to using and extending Britecharts, the reusable charting library based on Reusable API patterns. Finally, you'll see how to use D3.js along with React to document and build your charts to compose a charting library you can release into the NPM repository.
With Pro D3.js, you'll become an accomplished D3.js developer in no time.
What You Will Learn
- Create v5 D3.js charts with ES2016 and unit tests
- Develop modular, testable and extensible code with the Reusable API pattern
- Work with and extend Britecharts, a reusable charting library created at Eventbrite
- Use Webpack and npm to create and publish a charting library from your own chart collections
- Write reference documentation and build a documentation homepage for your library.
Who This Book Is For
Data scientists, data visualization engineers, and frontend developers with a fundamental knowledge of D3.js and some experience with JavaScript, as well as data journalists and consultants.
商品描述(中文翻譯)
超越 D3.js 的基礎,創建可維護、模組化且可測試的圖表,並將其打包成可作為開源軟體分發或私用的庫。本書將向您展示如何將常規的 D3.js 圖表代碼轉換為可重用和可擴展的模組。
您已經掌握了使用 D3.js 的基本知識,但現在是時候成為專業的 D3.js 實踐者。本書是您重構代碼、從小組件組合複雜視覺化、與其他開發者團隊合作以及將圖表與持續集成系統整合的起點。您將首先使用 D3.js v5、ES2015 和測試驅動的方法創建一個生產就緒的圖表,然後轉向使用和擴展 Britecharts,這是一個基於可重用 API 模式的可重用圖表庫。最後,您將學習如何將 D3.js 與 React 結合使用,以記錄和構建您的圖表,從而組成一個可以發佈到 NPM 倉庫的圖表庫。
透過《Pro D3.js》,您將迅速成為一名出色的 D3.js 開發者。
您將學到的內容:
- 使用 ES2016 和單元測試創建 v5 D3.js 圖表
- 使用可重用 API 模式開發模組化、可測試和可擴展的代碼
- 使用和擴展 Britecharts,這是一個由 Eventbrite 創建的可重用圖表庫
- 使用 Webpack 和 npm 從自己的圖表集合創建和發佈圖表庫
- 撰寫參考文檔並為您的庫建立文檔首頁
本書適合對象:
數據科學家、數據視覺化工程師和具備 D3.js 基礎知識及一些 JavaScript 經驗的前端開發者,以及數據記者和顧問。
作者簡介
Marcos Iglesias is a Senior Software Engineer who builds user interfaces at Eventbrite. He is passionate about creating test-driven data visualizations and dashboards using D3.js and frontend technologies such as ES2015, React, Redux, and Webpack. He enjoys writing about software, giving talks, and maintaining Britecharts, the open source charting library.
Marcos' experience releasing Britecharts and Britecharts-React gave him insights about creating, documenting, and publishing libraries as Open Source Software. He has written blog posts for Smashing Magazine, Eventbrite's Engineering Blog and Heart Internet. You can find him on Twitter @golodhros.
作者簡介(中文翻譯)
Marcos Iglesias 是一位資深軟體工程師,負責在 Eventbrite 建立使用者介面。他熱衷於使用 D3.js 及前端技術(如 ES2015、React、Redux 和 Webpack)創建以測試為驅動的數據可視化和儀表板。他喜歡撰寫有關軟體的文章、進行演講,並維護 Britecharts,這是一個開源圖表庫。
Marcos 在釋出 Britecharts 和 Britecharts-React 的經驗使他對創建、記錄和發佈開源軟體庫有了深入的見解。他曾為 Smashing Magazine、Eventbrite 的工程部落格和 Heart Internet 撰寫部落格文章。你可以在 Twitter 上找到他 @golodhros。


