Visualizing Streaming Data: Interactive Analysis Beyond Static Limits
暫譯: 視覺化串流數據:超越靜態限制的互動分析
Anthony Aragues

- 出版商: O'Reilly
- 出版日期: 2018-08-07
- 定價: $1,300
- 售價: 8.0 折 $1,040
- 語言: 英文
- 頁數: 200
- 裝訂: Paperback
- ISBN: 1492031852
- ISBN-13: 9781492031857
-
相關分類:
Data Science、Data-visualization
-
相關翻譯:
可視化流數據 (簡中版)
立即出貨 (庫存 < 3)
Oreilly英文書展|任選2書8折 詳見活動內容 »
-
 90折
$2,592Data Engineering for Multimodal AI: Architecting Scalable Systems for Next-Generation AI Applications
-
90折
$2,592Data Engineering for Multimodal AI: Architecting Scalable Systems for Next-Generation AI Applications
-
 90折
$2,592Practical Mlflow for Generative AI on Databricks: Build High-Quality AI Agents from Prompt Design to Production
-
 90折
$2,457MLOps with Databricks: Machine Learning and Genai Applications End to End
-
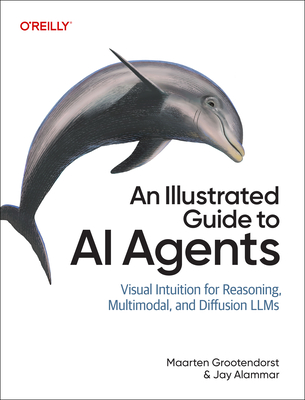 VIP 95折
An Illustrated Guide to AI Agents: Concepts and Code for Building Agents with Llms, Tools, and Memory (Paperback)
$2,780$2,641 -
 90折
$2,520Blue Team Handbook: Soc, Siem, and Threat Hunting: Practical Techniques for Security Operations and Threat Hunting Teams
-
 90折
$1,944Building Agentic Solutions with Microsoft Foundry: Patterns, Workflows, and Best Practices for Intelligent Agents
-
 90折
$1,917Learning Cybersecurity Fundamentals: A Practical Guide to Essential Cybersecurity Concepts
-
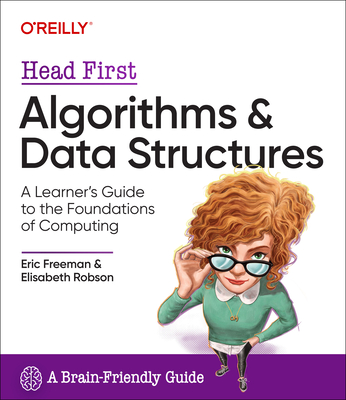 VIP 95折
Head First Algorithms and Data Structures: A Learner's Guide to the Foundations of Computing (Paperback)
$2,780$2,641 -
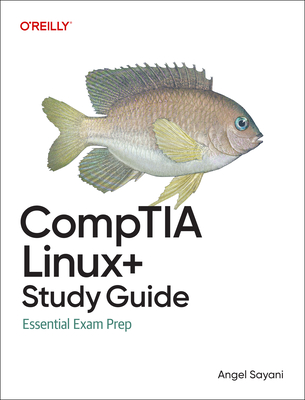 90折
$2,484Comptia Linux+ Study Guide: Essential Exam Prep
-
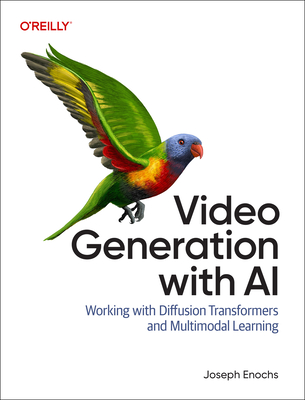 90折
$2,520Video Generation with AI: Working with Diffusion Transformers and Multimodal Learning (Paperback)
-
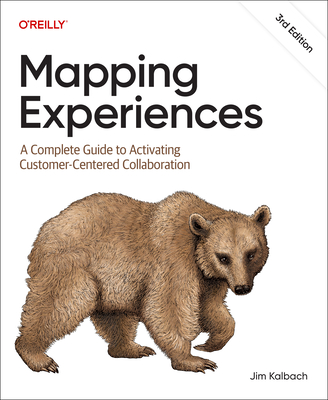 90折
$1,890Mapping Experiences: A Complete Guide to Activating Customer-Centered Collaboration 3/e
-
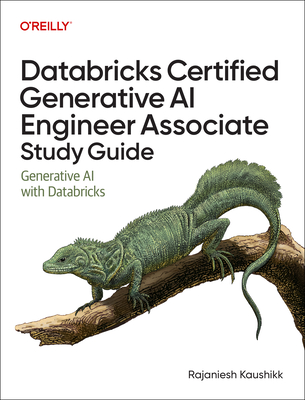 90折
$2,493Databricks Certified Generative AI Engineer Associate Study Guide: Generative AI with Databricks
-
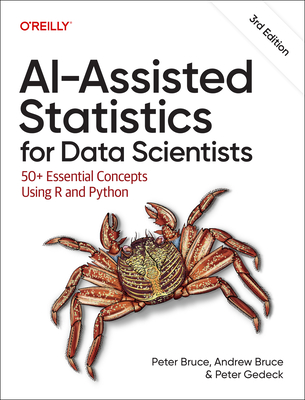 90折
$2,502Ai-Assisted Statistics for Data Scientists: 50+ Essential Concepts Using R and Python
-
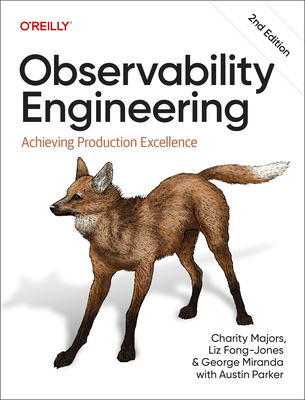 90折
$2,268Observability Engineering: Achieving Production Excellence, 2/e (Paperback)
-
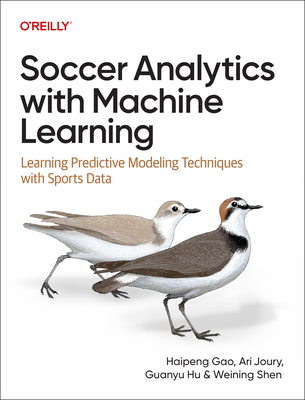 90折
$1,935Soccer Analytics with Machine Learning: Learning Predictive Modeling Techniques with Sports Data
-
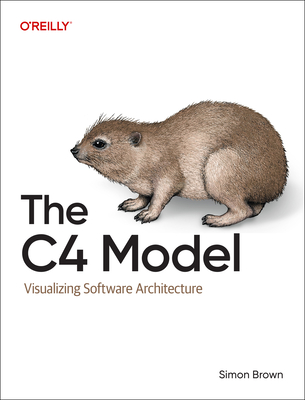 90折
$1,926The C4 Model: Visualizing Software Architecture (Paperback)
-
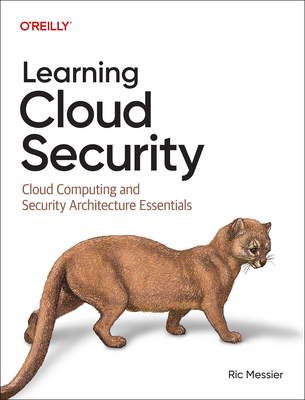 90折
$1,935Learning Cloud Security: Cloud Computing and Security Architecture Essentials
-
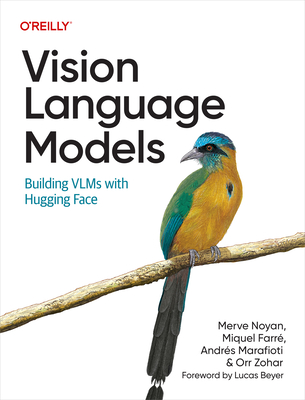 90折
$2,502Vision Language Models: Building Vlms with Hugging Face (Paperback)
-
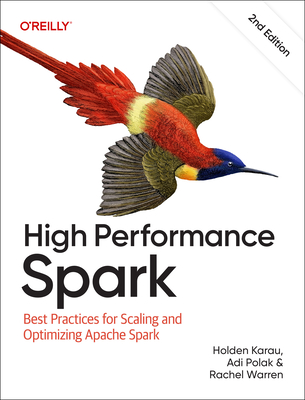 90折
$2,142High Performance Spark: Best Practices for Scaling and Optimizing Apache Spark 2/e
-
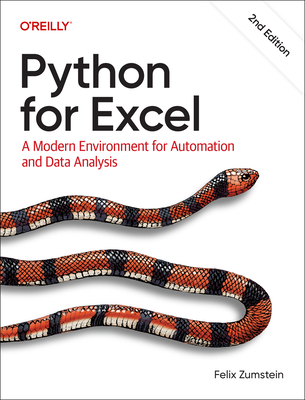 90折
$1,944Python for Excel: A Modern Environment for Automation and Data Analysis
-
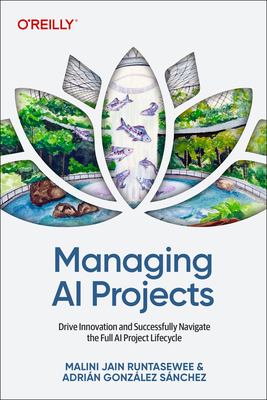 90折
$1,440Managing AI Projects: Drive Innovation and Successfully Navigate the Full AI Project Lifecycle (Paperback)
-
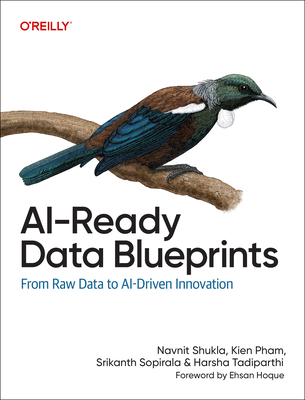 90折
$2,520AI-Ready Data Blueprints: From Raw Data to Ai-Driven Innovation (Paperback)
-
 90折
$1,917Certified Kubernetes Application Developer (Ckad) Study Guide: In-Depth Guidance and Practice (Paperback)
-
 90折
$2,484Large Language Models: The Hard Parts: Open Source AI Solutions for Common Pitfalls (Paperback)
相關主題


商品描述
While tools for analyzing streaming and real-time data are gaining adoption, the ability to visualize these data types has yet to catch up. Dashboards are good at conveying daily or weekly data trends at a glance, though capturing snapshots when data is transforming from moment to moment is more difficult—but not impossible.
With this practical guide, application designers, data scientists, and system administrators will explore ways to create visualizations that bring context and a sense of time to streaming text data. Author Anthony Aragues guides you through the concepts and tools you need to build visualizations for analyzing data as it arrives.
- Determine your company’s goals for visualizing streaming data
- Identify key data sources and learn how to stream them
- Learn practical methods for processing streaming data
- Build a client application for interacting with events, logs, and records
- Explore common components for visualizing streaming data
- Consider analysis concepts for developing your visualization
- Define the dashboard’s layout, flow direction, and component movement
- Improve visualization quality and productivity through collaboration
- Explore use cases including security, IoT devices, and application data
商品描述(中文翻譯)
在分析串流和即時數據的工具逐漸被採用的同時,這些數據類型的可視化能力尚未跟上。儀表板能夠快速傳達每日或每週的數據趨勢,但在數據瞬息萬變的過程中捕捉快照則更具挑戰性——但並非不可能。
在這本實用指南中,應用設計師、數據科學家和系統管理員將探索創建可視化的方式,為串流文本數據帶來上下文和時間感。作者 Anthony Aragues 將引導您了解構建可視化所需的概念和工具,以便在數據到達時進行分析。
- 確定您公司的串流數據可視化目標
- 確認關鍵數據來源並學習如何串流它們
- 學習處理串流數據的實用方法
- 建立一個用於與事件、日誌和記錄互動的客戶端應用程式
- 探索可視化串流數據的常見組件
- 考慮開發可視化的分析概念
- 定義儀表板的佈局、流向和組件移動
- 通過協作提高可視化質量和生產力
- 探索包括安全性、物聯網設備和應用數據的使用案例