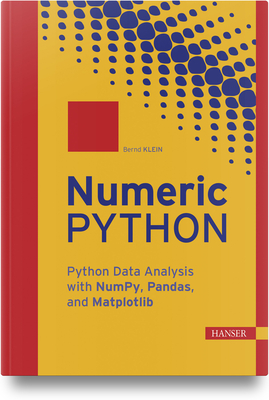
Numeric Python: Python Data Analysis with Numpy, Pandas, and Matplotlib
暫譯: 數值 Python:使用 Numpy、Pandas 與 Matplotlib 進行 Python 資料分析
Klein, Bernd
- 出版商: Hanser Publications
- 出版日期: 2026-05-15
- 售價: $2,660
- 貴賓價: 9.5 折 $2,527
- 語言: 英文
- 頁數: 572
- 裝訂: Quality Paper - also called trade paper
- ISBN: 1569904952
- ISBN-13: 9781569904954
-
相關分類:
Python、Data-visualization
海外代購書籍(需單獨結帳)
相關主題


商品描述
- Numerical computing with NumPy arrays, dtypes, vectorized operations
- Data analysis using Pandas DataFrames, grouping, pivoting, and time series
- Scientific visualization with Matplotlib plots, layouts, and contour graphics
- Real-world data work: files, missing data, binning, and indexing
- Applied Python: image processing, probability, and practical projects
This book teaches the Python fundamentals required to solve numerical problems in data science and machine learning.
The first part focuses on NumPy as the foundation of numerical programming, covering arrays as the core data type, numerical operations, broadcasting, and universal functions, as well as statistics, probability, Boolean masking, and file handling.
The second part is devoted to data visualization with Matplotlib, ranging from core concepts to line, bar, histogram, and contour plots. The third part introduces Pandas, including Series and DataFrames, importing and exporting Excel, CSV, and JSON files, handling missing data, and visualization directly within Pandas.
The fourth part presents practical applications, including a household budget project, an incomeexpenditure analysis, and an introduction to image processing.
The book concludes with a fifth part containing solutions to the numerous exercises that accompany almost every one of the 33 chapters.
商品描述(中文翻譯)
- 使用 NumPy 陣列、資料型別(dtypes)與向量化運算進行數值計算
- 使用 Pandas DataFrame 進行資料分析,包括分組、樞紐分析與時間序列
- 使用 Matplotlib 圖表、版面配置與等高線圖進行科學視覺化
- 真實世界的資料處理:檔案、遺漏資料、分箱與索引
- Python 應用:影像處理、機率與實務專案
本書教授解決資料科學與機器學習中數值問題所需的 Python 基礎。
第一部分著重於 NumPy,將其視為數值程式設計的基礎,涵蓋以陣列作為核心資料型別、數值運算、廣播(broadcasting)與通用函式(universal functions),以及統計、機率、布林遮罩(Boolean masking)和檔案處理。
第二部分專注於使用 Matplotlib 進行資料視覺化,內容從核心概念延伸至折線圖、長條圖、直方圖與等高線圖。第三部分介紹 Pandas,包括 Series 與 DataFrame、Excel、CSV 和 JSON 檔案的匯入與匯出、遺漏資料的處理,以及直接在 Pandas 中進行視覺化。
第四部分介紹實務應用,包括家庭預算專案、收入與支出分析,以及影像處理入門。
本書最後以第五部分作結,提供幾乎每一章(共 33 章)所附大量練習題的解答。