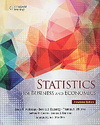
Statistics for Business and Economics Annotated Edition (IE-Paperback)
暫譯: 商業與經濟統計註解版 (IE-平裝本)
David R. Anderson , Dennis J. Sweeney , Thomas A. Williams , Jeffrey D. Camm , James J. Cochran
- 出版商: Cengage Learning
- 出版日期: 2014-06-30
- 售價: $1,080
- 貴賓價: 9.8 折 $1,058
- 語言: 英文
- 頁數: 1064
- ISBN: 9865840650
- ISBN-13: 9789865840655
-
相關分類:
機率統計學 Probability-and-statistics
立即出貨 (庫存=1)
買這商品的人也買了...
-
 財務報表分析 -- 理論與應用, 4/e (全一冊)
$600$570 -
 Intermediate Accounting IFRS, 4/e (Paperback)
$1,880$1,842 -
 深度學習 -- 最佳入門邁向 AI 專題實戰 (過版書特價)
$1,200$600 -
 統計學, 15e (Anderson: Statistics for Business & Economics, 15/e)
$820$804
相關主題
商品描述
<內容簡介>
New to this edition
•Descriptive Statistics--Chapters 2 and 3. We have significantly revised these chapters to incorporate new material on data visualization, best practices, and much more. Chapter 2 has been reorganized to include new material on side-by-side and stacked bar charts, and a new section has been added on data visualization and best practices I creating effective displays. Chapter 3 now includes coverage of the geometric mean in the section on measures of location. The geometric mean has many applications in the computation of growth rates for financial assets, annual percentage rates, and so on. Chapter 3 also includes a new section on data dashboards and how summary statistics can be incorporated to enhance their effectiveness.
•Discrete Probability Distributions--Chapter 5. The introductory material in this chapter has been revised to better explain the role of probability distributions and to show how the material on assigning probabilities in Chapter 4 can be used to develop discrete probability distributions. We point out that the empirical discrete probability distribution is developed by using the relative frequency method to assign probabilities. At the request of many users, we have added a new Section 5.4 that covers bivariate discrete distributions and financial applications. We show how financial portfolios can be constructed and analyzed using these distributions.
•Chapter 12--Comparing Multiple Proportions, Tests of Independence, and Goodness of Fit. This chapter has undergone a major revision. We have added a new section on testing the equality of three or more population proportions. This section includes a procedure for making multiple comparison tests between all pairs of population proportions. The section on the test of independence has been rewritten to clarify that the test concerns the independence of two categorical variables. Revised appendixes with step-by-step instructions for Minitab, Excel, and StatTools are included.
•New Case Problems. We have added 8 new case problems to this edition; the total number of cases is 31. Three new descriptive statistics cases have been added to chapters 2 and 3. Five new case problems involving regression appear in Chapters 14, 15, and 16. These case problems provide students with the opportunity to analyze larger data sets and prepare managerial reports based on the results of their analysis.
•New Statistics in Practice Applications. Each chapter begins with a Statistics in Practice vignette that describes an application of the statistical methodology to be covered in the chapter. New to this edition is a Statistics in Practice for Chapter 2 describing the use of data dashboards and data visualization at the Cincinnati Zoo and Botanical Garden. We have also added a Statistics i Practice to Chapter 4 describing how a NASA team used probability to assist in the rescue of 33 Chilean miners trapped by a cave-in.
•New Examples and Exercises based on Real Data. We continue to make a significant effort to update our text examples and exercises with the most current real data and referenced sources of statistical information. In this edition, we have added approximately 180 new examples and exercises based on real data and referenced sources. Using data from sources also used by The Wall Street Journal, USA Today, Barron's, and others, we have drawn from actual studies to develop explanations and to create exercises that demonstrate the many uses of statistics in business and economics. We believe that the use of real data helps generate more student interest in the material and enables the student to learn about both the statistical methodology and its application. The twelfth edition contains over 350 examples and exercises based on real data.
<章節目錄>
1. Data and Statistics.
2. Descriptive Statistics: Tabular and Graphical Displays.
3. Descriptive Statistics: Numerical Measures.
4. Introduction to Probability.
5. Discrete Probability Distributions.
6. Continuous Probability Distributions.
7. Sampling and Sampling Distributions.
8. Interval Estimation.
9. Hypothesis Tests.
10. Inference about Means and Proportions with Two Populations.
11. Inferences about Population Variances.
12. Comparing Multiple Proportions, Test of Independence and Goodness of Fit.
13. Experimental Design and Analysis of Variance.
14. Simple Linear Regression.
15. Multiple Regression.
16. Regression Analysis: Model Building.
17. Time Series Analysis and Forecasting.
18. Nonparametric Methods.
Appendix A. References and Bibliography.
Appendix B. Tables.
Appendix C. Summation Notation.
Appendix D. Self-Test Solutions and Answers to Even –Numbered Exercises.
Appendix E. Microsoft Excel 2010 and Tools for Statistical Analysis.
Appendix F. Computing p-Values Using Minitab and Excel.
商品描述(中文翻譯)
內容簡介
新版本的內容
• 描述性統計 - 第2章和第3章。我們對這些章節進行了重大修訂,以納入有關數據可視化、最佳實踐等新材料。第2章已重新組織,新增了有關並排和堆疊條形圖的新材料,並新增了一節有關數據可視化和創建有效顯示的最佳實踐。第3章現在包括了幾何平均數在位置測量部分的內容。幾何平均數在計算金融資產的增長率、年百分比率等方面有許多應用。第3章還新增了一節有關數據儀表板及如何將摘要統計納入以增強其有效性。
• 離散機率分佈 - 第5章。本章的介紹材料已修訂,以更好地解釋機率分佈的角色,並展示第4章中分配機率的材料如何用於開發離散機率分佈。我們指出,經驗離散機率分佈是通過使用相對頻率方法來分配機率而開發的。應許多用戶的要求,我們新增了第5.4節,涵蓋雙變量離散分佈和金融應用。我們展示了如何使用這些分佈來構建和分析金融投資組合。
• 第12章 - 比較多個比例、獨立性檢驗和適合度檢驗。本章經過重大修訂。我們新增了一節有關檢驗三個或更多母體比例相等的內容。這一節包括了一個程序,用於對所有母體比例的每一對進行多重比較檢驗。獨立性檢驗的部分已重新編寫,以澄清該檢驗涉及兩個類別變數的獨立性。修訂的附錄包含了Minitab、Excel和StatTools的逐步指導。
• 新案例問題。我們在本版中新增了8個案例問題;總案例數為31。第2章和第3章新增了三個描述性統計案例。第14、15和16章出現了五個涉及回歸的新案例問題。這些案例問題為學生提供了分析更大數據集的機會,並根據分析結果準備管理報告。
• 新的實務應用統計。每章開始時都有一個實務應用統計的短文,描述本章將涵蓋的統計方法的應用。本版新增了第2章的實務應用統計,描述了辛辛那提動物園和植物園如何使用數據儀表板和數據可視化。我們還新增了第4章的實務應用統計,描述NASA團隊如何使用機率協助救援33名被塌方困住的智利礦工。
• 基於真實數據的新範例和練習。我們持續努力更新文本範例和練習,使用最新的真實數據和參考的統計信息來源。在本版中,我們新增了約180個基於真實數據和參考來源的新範例和練習。使用《華爾街日報》、《今日美國》、《巴倫周刊》等來源的數據,我們從實際研究中提取解釋,並創建展示統計在商業和經濟中多種用途的練習。我們相信,使用真實數據有助於提高學生對材料的興趣,並使學生能夠了解統計方法及其應用。第十二版包含超過350個基於真實數據的範例和練習。
章節目錄
1. 數據與統計。
2. 描述性統計:表格和圖形顯示。
3. 描述性統計:數值測量。
4. 機率簡介。
5. 離散機率分佈。
6. 連續機率分佈。
7. 抽樣與抽樣分佈。
8. 區間估計。
9. 假設檢驗。
10. 兩個母體的均值與比例推斷。
11. 母體變異數的推斷。
12. 比較多個比例、獨立性檢驗和適合度檢驗。
13. 實驗設計與變異數分析。
14. 簡單線性回歸。
15. 多元回歸。
16. 回歸分析:模型建立。
17. 時間序列分析與預測。
18. 非參數方法。
附錄A. 參考文獻與書目。
附錄B. 表格。
附錄C. 總和符號。
附錄D. 自我測試解答及偶數題的答案。
附錄E. Microsoft Excel 2010及統計分析工具。
附錄F. 使用Minitab和Excel計算p值。


