Learn D3.js - Second Edition: Create Stunning Interactive Web Visualizations with D3.js v7 and Modern JavaScript
暫譯: 學習 D3.js - 第二版:使用 D3.js v7 和現代 JavaScript 創建驚人的互動式網頁視覺化
Rocha, Helder Da
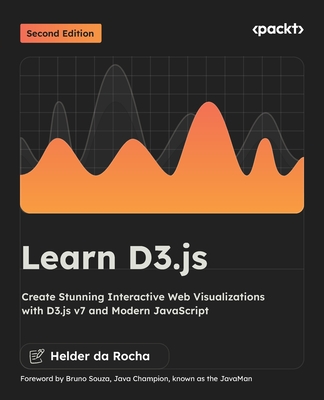
- 出版商: Packt Publishing
- 出版日期: 2026-06-26
- 售價: $1,850
- 貴賓價: 9.5 折 $1,757
- 語言: 英文
- 頁數: 582
- 裝訂: Quality Paper - also called trade paper
- ISBN: 1837636869
- ISBN-13: 9781837636860
-
相關分類:
Data-visualization
海外代購書籍(需單獨結帳)
商品描述
Master data visualization with D3.js v7 using modern web standards and real-world projects to build interactive charts, maps, and visual narratives
Key Features:
- Build dynamic, data-driven visualizations using D3.js v7 and ES2019+
- Create D3 data visualizations, including charts, maps, and networks
- Master data visualization with JavaScript through hands-on examples
Book Description:
Learn D3.js, Second Edition, is a fully updated guide to building interactive, standards-compliant data visualizations for the web using D3.js v7 and modern JavaScript. Whether you're a developer, designer, data journalist, or analyst, this book will help you master the core techniques for transforming data into compelling, meaningful visuals.
Starting with fundamentals like selections, data binding, and SVG, the book progressively covers scales, axes, animations, hierarchical data, and geographical maps. Each chapter includes short examples and a hands-on project with downloadable code you can run, modify, and use in your own work.
This new edition introduces improved chapter structure, updated code samples using ES2019 standards, and better formatting for readability. Chapters were completely rewritten to focus on the most important topics first, with suggested exercises after each section, complete with commented solutions and online step-by-step tutorials. All code snippets are drawn from real-world D3 data visualization projects available in a GitHub repository, which also includes bonus content on integrating D3 into applications and migrating legacy code.
With its practical approach, this book remains one of the most respected resources for learning D3.js and creating interactive data visualizations with JavaScript.
What You Will Learn:
- Bind data to DOM elements and apply transitions and styles
- Build interactive bar, line, pie, scatter, tree, and animated network charts
- Implement interactive behaviors with zoom, drag, and tooltips
- Visualize hierarchical data, flows, and maps using D3 layouts and projections
- Use D3 with HTML5 Canvas for high-performance rendering
- Create thematic geographic maps using standard GeoJSON and TopoJSON shapefiles
- Complete 100+ exercises with commented templates and solutions
- Build full visualizations through 10 guided online exercises
Who this book is for:
This book is for web developers, data journalists, designers, analysts, and anyone who wants to create interactive, web-based data visualizations. A basic understanding of HTML, CSS, and JavaScript is recommended. No prior knowledge of SVG or D3 is required.
Table of Contents
- Data-driven Documents
- Essential JavaScript for D3
- Essential SVG for D3
- Quick Start
- Loading and Parsing Data
- Selections and Data Binding
- Working with Data
- Axes
- Scales
- Colors
- Creating Line and Area Charts
- Creating Pies and Stacks
- Transitions and Animation
- Events and Interactivity
- Creating Tree Visualizations
- Creating Partitions and Enclosures
- Visualizing Flows and Networks
- Force-Directed Networks
- Cartographical Visualizations
- References and Additional Sources
商品描述(中文翻譯)
**掌握使用 D3.js v7 的資料視覺化,透過現代網頁標準和實際專案來建立互動式圖表、地圖和視覺敘事**
**主要特點:**
- 使用 D3.js v7 和 ES2019+ 建立動態、數據驅動的視覺化
- 創建 D3 數據視覺化,包括圖表、地圖和網絡
- 通過實作範例掌握使用 JavaScript 的資料視覺化
**書籍描述:**
《學習 D3.js(第二版)》是一本全面更新的指南,旨在使用 D3.js v7 和現代 JavaScript 為網頁構建互動式、符合標準的數據視覺化。無論您是開發人員、設計師、數據記者還是分析師,本書將幫助您掌握將數據轉化為引人入勝且有意義的視覺效果的核心技術。
本書從選擇、數據綁定和 SVG 等基本概念開始,逐步涵蓋比例尺、坐標軸、動畫、層次數據和地理地圖。每一章都包含簡短的範例和一個實作專案,附有可下載的代碼,您可以運行、修改並在自己的工作中使用。
這一新版引入了改進的章節結構,更新的代碼範例使用 ES2019 標準,並改善了可讀性。各章節完全重寫,首先聚焦於最重要的主題,每個部分後都有建議的練習,並附有註解解答和線上逐步教學。所有代碼片段均來自於實際的 D3 數據視覺化專案,這些專案可在 GitHub 倉庫中找到,並包含有關將 D3 整合到應用程式和遷移舊代碼的額外內容。
憑藉其實用的方法,本書仍然是學習 D3.js 和使用 JavaScript 創建互動式數據視覺化的最受尊敬的資源之一。
**您將學到的內容:**
- 將數據綁定到 DOM 元素並應用過渡和樣式
- 建立互動式的條形圖、折線圖、圓餅圖、散點圖、樹狀圖和動畫網絡圖
- 實現縮放、拖曳和提示框的互動行為
- 使用 D3 佈局和投影可視化層次數據、流和地圖
- 使用 D3 與 HTML5 Canvas 進行高效能渲染
- 使用標準 GeoJSON 和 TopoJSON 形狀文件創建主題地理地圖
- 完成 100 多個練習,附有註解範本和解答
- 通過 10 個指導性的線上練習建立完整的視覺化
**本書適合的人群:**
本書適合網頁開發人員、數據記者、設計師、分析師以及任何希望創建互動式網頁數據視覺化的人。建議具備 HTML、CSS 和 JavaScript 的基本知識,無需具備 SVG 或 D3 的先前知識。
**目錄**
- 數據驅動的文檔
- D3 的基本 JavaScript
- D3 的基本 SVG
- 快速入門
- 加載和解析數據
- 選擇和數據綁定
- 處理數據
- 坐標軸
- 比例尺
- 顏色
- 創建折線圖和面積圖
- 創建圓餅圖和堆疊圖
- 過渡和動畫
- 事件和互動性
- 創建樹狀視覺化
- 創建分區和包圍
- 可視化流和網絡
- 力導向網絡
- 地圖視覺化
- 參考文獻和附加資源


